Line Balancing in Manufacturing: How to Create Flow at the Right Rate

You don’t rise to the level of your goals, you fall to the level of your systems. – Atomic Habits
That quote applies directly to production flow. A manufacturing line does not underperform because of bad goals — it underperforms because the system was never properly balanced. Line balancing in manufacturing is the tool that fixes that. This post explains what it is, how the calculation works, and how to apply it to any production line regardless of what you are making.
The importance of flow in manufacturing is not a new idea. In Lean Thinking (1996), James Womack and Daniel Jones set out five principles that define a lean organisation: define value, map the value stream, create flow, establish pull, and seek perfection. Flow is the third principle — and its position is deliberate. Womack and Jones are explicit that a pull system, where downstream demand signals upstream production, cannot function effectively until flow has first been established. Line balancing is one of the primary tools that makes that transition possible.
What Is Line Balancing in Manufacturing?
Line balancing is the process of distributing work across the stages of a production line so that each station completes its tasks within the time allowed by customer demand. That time boundary is called takt time — the maximum time available per unit at each stage if the line is to meet the required output rate.
When a line is well balanced, work flows continuously from one station to the next at a consistent pace. When it is not, some stations finish early and wait, others become bottlenecks, and output becomes irregular — exactly the kind of system-level failure James Clear’s quote describes.
The principle applies at any scale: from a five-station assembly cell producing precision components to a factory assembling rockets.
The Starship Example — and Why It Matters
In a widely viewed video produced by Tim Dodd — First Look Inside SpaceX’s Starfactory with Elon Musk — Musk makes a point that any manufacturing engineer will recognise immediately: “Continuous linear flow is key.”
He goes further, explaining that having all stages produce work at or around the same time allows the product to move along at a consistent pace — no conveyor belt required. That is a direct, real-world description of a balanced production line, applied to one of the most complex manufactured products ever attempted.
It is also a useful reminder that line balancing is not a tool reserved for high-volume consumer goods. If the principle is sound enough for Starship, it is sound enough for your production line.
The Takt Time Calculation
Before you can balance a line, you need to establish takt time — the heartbeat of your production system.
The formula is:
Takt Time = Available Production Time ÷ Customer Demand
To make this concrete, assume SpaceX is targeting 100 Starships per year at a facility running 24 hours a day, 7 days a week.
Available production time per day: 24 hours × 60 minutes = 1,440 minutes per day
Customer demand rate: 100 ships ÷ 365 days = 0.274 ships per day
Takt time: 1,440 ÷ 0.274 = 5,255 minutes per ship
To account for real-world inefficiencies — planned maintenance, minor stoppages, changeovers — I apply an 85% efficiency factor. This is a figure I have developed and validated across the production systems I have built and improved over my career, and one that is broadly regarded as an accepted working benchmark in manufacturing practice. This gives a working cycle time target of:
5,255 × 0.85 = 4,467 minutes per ship (approximately 74.5 hours)
That means no individual stage in the production line should take longer than 4,467 minutes. Any stage that exceeds this figure will hold up every stage downstream of it.
For context, Musk has stated a target of 1,000 Starships per year. Run the same calculation at that rate and takt time drops to approximately 74 minutes per ship — a 60-fold reduction. That is the scale of the manufacturing challenge.
Note: A dedicated post on takt time — including how to calculate it for shift-based production with planned downtime — is in preparation. An internal link will be added here on publication.
How to Balance the Line
Once takt time is established, the balancing process follows a clear sequence.
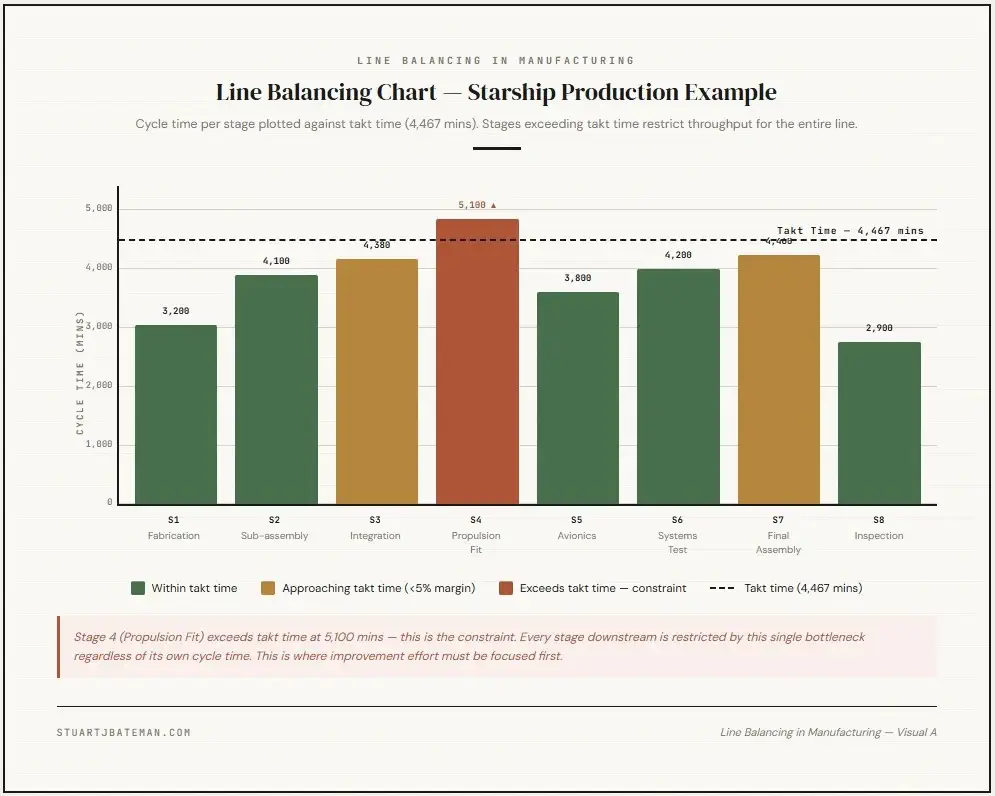
Step 1 — Map every stage and its current cycle time
List each station or stage in the line and record how long it currently takes to complete its work. Any stage that exceeds takt time is a bottleneck. Any stage significantly under takt time is either underloaded or masking a measurement problem.
Step 2 — Break each stage down to its elements using a Work Combination Chart
A work combination chart decomposes each stage into its individual task elements, with a time recorded against each. This is where you identify which specific tasks are driving the cycle time — and whether any of them can be moved, reduced, or eliminated.
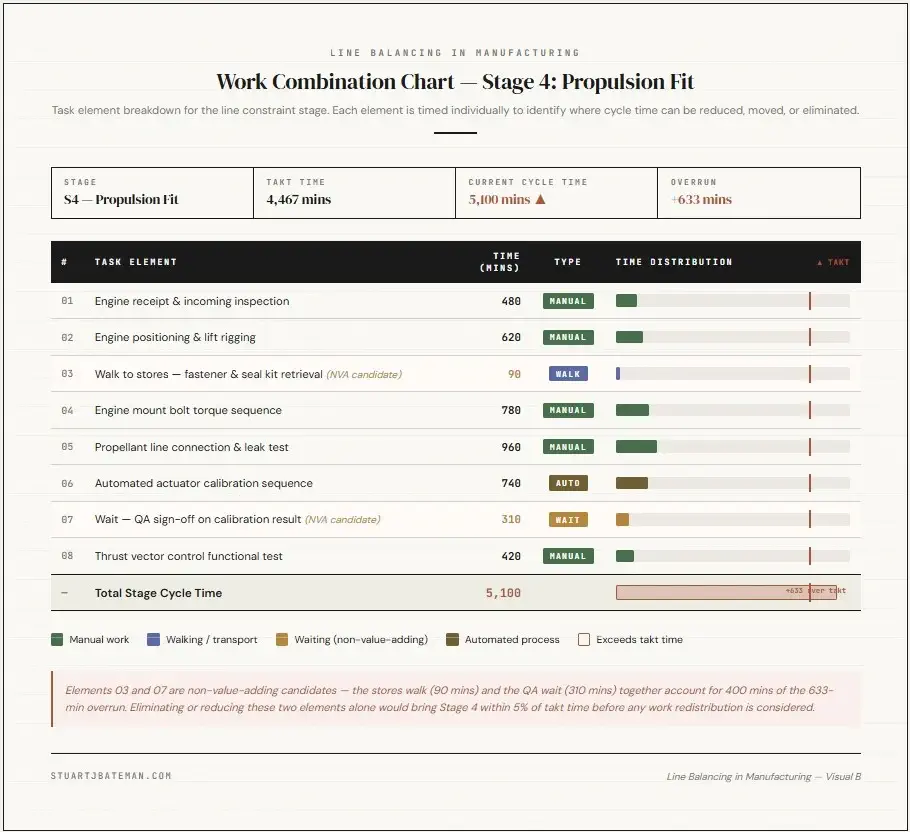
This step requires time studies. Walk the line, observe the work, and record what is actually happening — not what the standard operating procedure says should be happening. The two are rarely identical.
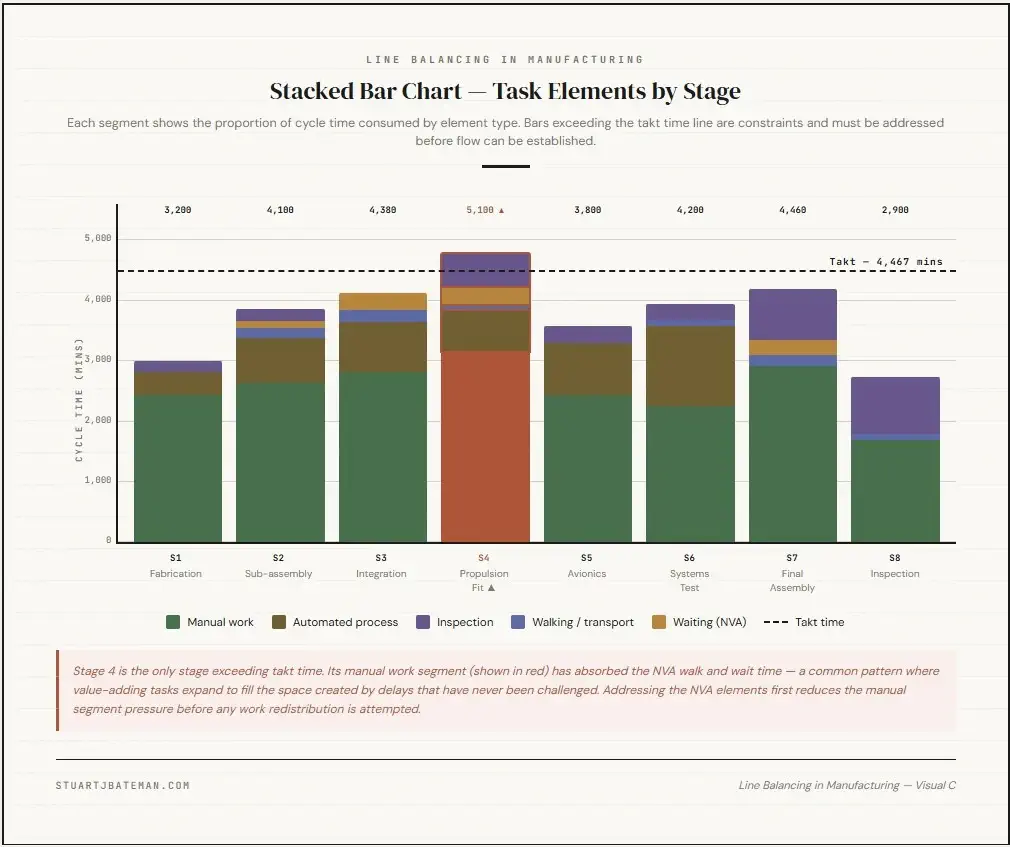
Step 3 — Build a stacked bar chart for each stage
Plot each stage as a stacked bar, with each element shown as a proportion of the total cycle time. Overlay the takt time as a horizontal reference line. Any bar that exceeds that line is a problem. The stacked format lets you see at a glance which elements within the bar are contributing most to the overrun.
Step 4 — Balance by moving, reducing, or eliminating elements
With the stacked bar chart in front of you, the options become clear. Elements can be moved to an adjacent stage if the sequence allows it. Tasks can be split between stages. Non-value-adding elements can be targeted for elimination before anything else is touched.
A practical note: some elements have constraints. A deburring step must follow a machining step. A torque check must follow a fastening operation. Do not move elements purely to make the chart look balanced — the physical sequence of operations must remain logical and safe.
Step 5 — Rebalance and recheck
Line balancing is iterative. The first pass will get you close. The second pass refines it. On a complex line you may go through several cycles before each stage consistently meets takt time.
A Word on Upstream Constraints
One of the most common errors when balancing a line is making upstream stages significantly faster than takt time. The logic seems sound — a fast upstream stage provides buffer — but in practice it creates an inventory pile-up at the first downstream stage that cannot keep pace.
The target is for every stage to run at or just under takt time. Upstream speed in excess of that does not add capacity; it adds work-in-progress and obscures the real constraint.
Why Focusing on Flow Improves the Whole System
There is a well-established principle in manufacturing systems thinking that goes beyond the mechanics of balancing individual stations: when you focus on improving flow through a system, the system as a whole tends to improve.
Eliyahu Goldratt developed this argument in The Goal (1984) through his Theory of Constraints. Goldratt’s central position is that every system has at least one constraint — a stage or resource that limits overall throughput. Attempting to optimise individual stages in isolation, without understanding where the true constraint sits, produces local improvements that leave overall system performance unchanged. The correct focus is flow through the constraint, because that is where throughput is determined.
Applied to line balancing, this means the stacked bar chart and work combination chart are not just balancing tools — they are constraint identification tools. The stage that consistently exceeds takt time is the constraint. Improving flow at that point improves output for the entire line, regardless of how efficiently every other stage is running.
Goldratt’s insight extends beyond material flow. The same principle applies to information flow — drawing approvals, engineering change requests, inspection sign-offs, purchase orders. In many manufacturing environments, the constraint is not on the shop floor at all; it is in the information chain that feeds it. A line balancing exercise that reveals a physical bottleneck is often exposing a deeper information flow problem upstream of it.
What Line Balancing Actually Tells You
Line balancing is not simply a scheduling exercise. Done properly, it is a diagnostic tool that surfaces the real structure of your production system — where time is being spent, where constraints sit, and where improvement effort will have the greatest impact.
Womack and Jones position flow as a prerequisite to pull for precisely this reason: until the system moves at a consistent, predictable rate, there is nothing stable enough to pull against. Goldratt reinforces it from a different direction — local optimisation without system-level flow awareness is effort without leverage.
Musk’s point stands: setting up a manufacturing process correctly is harder than designing the product. Line balancing is one of the tools that makes it possible.
My Experience — Learning It, Applying It, Adapting It
My training in line balancing came from my time as a Manufacturing Engineer at Stannah Stairlifts. By the time I arrived, the business had already made a significant investment in flow production across its assembly and fabrication areas — the infrastructure was there, and so were the engineers who had built it.
I had the opportunity to work directly with those engineers as they designed a new line offline to test the assembly requirements of a product under development. This is where I first saw line balancing applied in practice rather than in theory.
Their timing method was built around what they called the “one eye one arm worker” — a deliberate worst-case approximation. Rather than timing their best operator on their best day, they modelled the slowest realistic performance: one eye, one arm, working at a sustainable pace. This gave them a conservative time base that the line could be designed around with confidence, rather than one that only worked under ideal conditions.
They had the parts, the process sequence, and a conveyor line to work against — built bottom up from the assembly requirements. All of the timing data was held in an Excel spreadsheet where elements could be dragged between stations and the stacked bar charts would update in real time to reflect the rebalanced state. What impressed me most was the scenario planning built into the model. Because of resource constraints on the assembly floor, the line had been optimised for three, four, five, and six stations — so that operators could be trained to cover any configuration depending on where the team leader needed resource on a given day. That flexibility was designed in from the start, not retrofitted.
The fabrication area told a similar story but with a sharper result. The team had run a lean trial focused on balancing resources and throughput to achieve a target of 81 carriage frames in 3 hours. The machines were arranged in a U-shape, and tooling was either bought or adapted specifically to the task. The result was striking: a production run that previously occupied two full shifts — 16 hours — was completed in 3 hours. That outcome came directly from line balancing: measuring what needed to be done, timing the work, understanding distances and movement, and calculating how many people were actually needed.
I took that experience into my role at Accuracy International. I trialled the approach on an assembly line with some success, but the most significant application was in manufacturing. The company had invested in several new machines — lathes, a honing machine, milling machines — and I was tasked with creating a production flow line around them.
I measured everything: cycle times for each machine, operator movement, inspection steps, tool changes, loading and unloading. The full picture of what the line actually demanded, not what was assumed. I brought that data back into a spreadsheet and worked through the same balancing exercises I had been shown at Stannah.
The solution here was more complex than a straightforward balance. The machines had different cycle times that could not be equalised through task redistribution alone, so I introduced a supermarket — a small, controlled buffer of work-in-progress held at the constraint stage. This kept the constraint machine continuously utilised while the faster processes around it were optimised to feed it at the right rate without overproducing. The result was a stable flow line where the constraint was always working and nothing upstream was running ahead of what the system could absorb — a practical application of exactly the principle Goldratt describes in the Theory of Constraints.
A SMED exercise followed later to address tool change time at the constraint — but that is a separate story.
Key Takeaways
- Line balancing distributes work across production stages so that each station meets the rate set by customer demand
- Takt time is the calculation that sets that rate — available production time divided by customer demand
- Womack and Jones identify flow as the third of five lean principles, and as a prerequisite to establishing pull
- Goldratt’s Theory of Constraints confirms that focusing on flow through the system’s constraint improves overall throughput — not local optimisation of individual stages
- The work combination chart and stacked bar chart are the practical tools used to identify and resolve imbalances
- Elements should be moved, reduced, or eliminated — in that order of preference
- Do not make upstream stages faster than takt time; it creates downstream pile-up rather than additional capacity
- The constraint is not always physical — information flow bottlenecks upstream of the line are a common and underdiagnosed cause of poor throughput
Frequently Asked Questions
What is line balancing in manufacturing? Line balancing is the process of distributing tasks across production stages so that each station completes its work within the time allowed by customer demand. That time limit is called takt time.
What is the relationship between line balancing and lean manufacturing? In Lean Thinking (1996), Womack and Jones identify creating flow as the third of five lean principles, positioned deliberately before establishing pull. Line balancing is one of the primary tools used to achieve that flow, making it a foundational step in any lean implementation.
What is takt time and how is it calculated? Takt time is the maximum time available to complete one unit at each stage of a production line. It is calculated by dividing available production time by customer demand over the same period.
What is a work combination chart? A work combination chart breaks a production stage down into its individual task elements, each with a recorded time. It is used to identify which specific tasks are driving the cycle time and whether they can be moved, reduced, or eliminated.
What happens if one stage consistently exceeds takt time? That stage is the constraint — in Goldratt’s terms, the point that limits throughput for the entire system. It should be prioritised for analysis using a work combination chart and stacked bar chart to identify which elements are driving the overrun. Improving flow at that point improves output for the whole line.
Author Bio
Stuart Bateman is a Chartered Engineer with 22 years of experience across project, manufacturing, and production engineering. He writes about engineering tools, career development, and practical manufacturing techniques for engineers at every stage of their career.
References & Further Reading
Takt time calculation — internal link (in preparation)
Womack, J.P. and Jones, D.T. (1996). Lean Thinking: Banish Waste and Create Wealth in Your Corporation. Simon & Schuster.
Goldratt, E.M. and Cox, J. (1984). The Goal: A Process of Ongoing Improvement. North River Press.
Clear, J. (2018). Atomic Habits: An Easy and Proven Way to Build Good Habits and Break Bad Ones. Penguin Random House.
Internal – Lean
Check out more Lean Manufacturing topics:
- What is Flow Production? Complete Implementation Guide 2025
- Learn what flow production is and how to implement it in manufacturing. Includes step-by-step process, real-world examples, and proven tools to increase output.
- How to create a Value Stream map
- Companies strive to reduce costs, create space and continuously imp, one way to help make this happen is by creating a Value Stream Map.
- How to…use the Theory of Constraints (TOC): Streamlining Production
- Unlock efficiency with Theory of Constraints! Learn to identify bottlenecks, optimize processes, and boost productivity for success.
- Success Story: Transforming Workflows with Continuous Improvement
- Explore a real-life success story of implementing continuous improvement activities. How the involvement of operators led to significant changes.
- How to..Conduct 3S
- Master 3S methodology (Sort, Set, Shine) with this complete lean manufacturing guide. Learn implementation steps, workplace organization, and 3S vs 5S differences from 22 years experience.


What are your thoughts? Have I covered everything or is there more you know and would like to share?
I’m always learning and improving this site and my blogs, so please feel free to get in touch with me via LinkedIn or this site to discuss any topics I have covered.
If you’re having trouble finding ways to progress check out these sites filled with free learning tools:


Discover more from The Chartered Engineer
Subscribe to get the latest posts sent to your email.
