Do you want to know, how do engineer’s use statistics to improve their work?
If the learner hasn’t learned. The teacher hasn’t taught – Managing to learn

Where to start with Statistics
The utilization of statistics in engineering is akin to maintaining an open mind and adopting a sceptical approach, much like in hypothesis testing. But how exactly do engineers employ statistics to improve their work, and how can you derive benefits from it?
So, “What are the uses of statistics in Engineering?”
Statistics enables us to understand the variations within our production systems, or the variations within our designs.
Since we can never test the entire population (or of us the long-term effects of a design) we use statistics to analysis sample data to then predict and understand the patterns and likely events that will happen.
Uses:
- Process Validation (CPK): Validates whether a manufacturing process is capable of meeting specifications consistently.
- Process Certification (CP): Certifies that a process meets predetermined standards.
- Variable Analysis (Regression): Determines relationships between variables and predicts outcomes.
- Identifying Contributing Factors (Regression): Pinpoints factors influencing outcomes.
- Statistical Process Control (SPC): Monitors and maintains product quality by detecting variations.
- Hypothesis Testing: Understands factors influencing each other.
- Confidence Intervals: Estimates the range of likely values.
- Statistical Inference: Predicts behaviours based on established relationships.
- Histograms: Utilized for graphical representation and understanding of data distribution.
Example of statistics being used in Engineering
So, for example you have a defect within your manufactured part but you don’t know what input into the system that creates it is contributing to the defect (there could be many inputs but using pareto we can isolate the top 80% to investigate), you design an experiment to monitor and record data, after which you go through various regression models to see what combination of inputs affect the output you’re concerned about.
You then focus on fixing that input and then re-run your tests.
But we need to be sure that we have enough information to make sure that the data represents the population, usually 30 individual data points will give you more confidence.
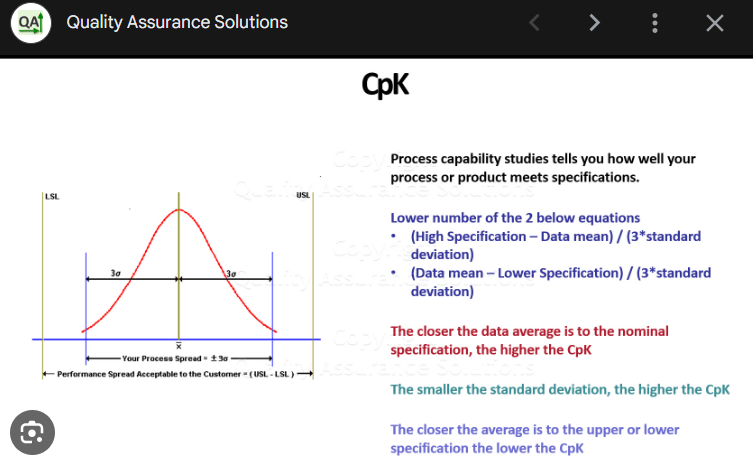
In production we use CPK (capability studies tied to the mean) to make sure machines and processes are capable of repeating and reproducing the same dimensions within the given tolerances.

In investigations we use confidence levels to understand how likely an event is.

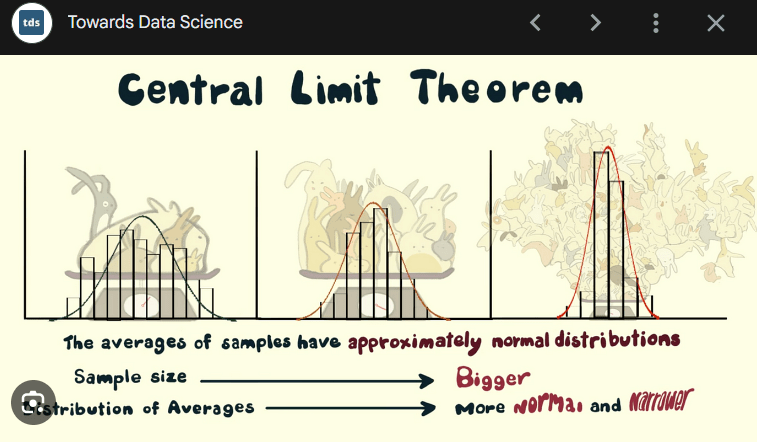
Then there’s the Central limit theorem, which states the more data you collect the more your histogram of that data will show a normal distribution (what the likely event is).

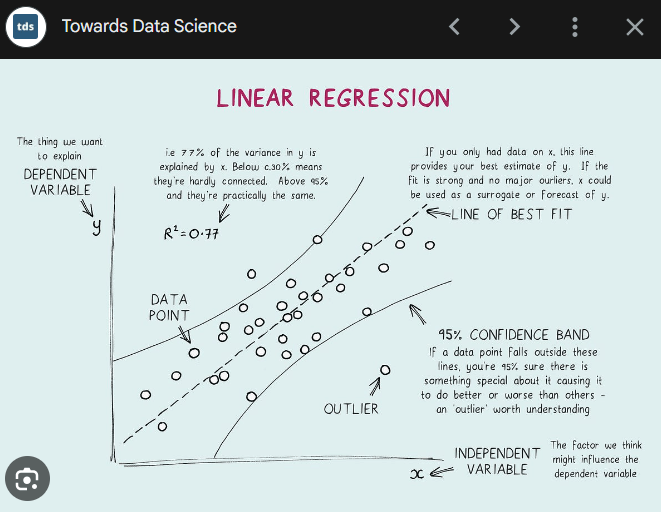
Then we have regression charts to understand relationships between variables, here we want to understand if there is a relationship and if so, how strong is it? From there we can calculate the relationship i.e. if I had a value from one, what is its corresponding value in the other?

Benefits of using statistics
Using statistics in manufacturing problems offers numerous benefits, including:
1. Process Improvement: Statistical tools such as control charts, hypothesis testing, and design of experiments (DOE) enable manufacturers to analyse and improve processes. By identifying sources of variation and optimizing process parameters, manufacturers can enhance product quality, reduce defects, and increase efficiency.
2. Data-Driven Decision Making: Statistics provide a systematic approach to decision making by leveraging data. Through techniques like regression analysis and predictive modelling, manufacturers can make informed decisions about product design, process optimization, inventory management, and resource allocation.
3. Quality Control: Statistical process control (SPC) techniques help monitor and maintain product quality by detecting variations and deviations from desired specifications. By implementing tools like control charts and capability analysis, manufacturers can ensure consistency in product quality, minimize defects, and meet customer expectations.
4. Cost Reduction: By identifying and addressing root causes of variability and defects, statistical methods contribute to cost reduction in manufacturing. Through initiatives such as Six Sigma and lean manufacturing, which heavily rely on statistical tools, manufacturers can streamline processes, eliminate waste, and improve overall operational efficiency.
5. Risk Management: Statistics aid in assessing and managing risks associated with manufacturing processes and products. Techniques like failure mode and effects analysis (FMEA) enable manufacturers to proactively identify potential failure modes, prioritize risks, and implement preventive measures to mitigate them.
Using statistics in engineering to isolate the cause
The steps I use to identify causes is:
- Define the problem (what is the output defect)
- Measure the output defect using Run charts (how often does it occur)
- Capture CPK of output against specifications (baseline how far out it is)
- List input variables by conducting Ishikawa
- Isolate inputs under our control to measure
- Measure inputs
- Produce scatter diagrams of each input against the output to find relationships
- Use regression analysis to understand that relationship
- ID contributing factors
- Design a control plan to experiment with solutions while monitoring the output
- Positive effects are noted and implemented.
While this only shows one route to take, there are other routes where the results can be measured and it’s most a fact collecting exercise to find what has changed to create a solution with.
Again, I follow the DMAIC structure with each process and use statistics when there is data to collect and analyse.
Conclusion
This is a big subject to cover, but in essence with Statistics we can isolate and understand what inputs affect which outputs.
In summary, incorporating statistics into manufacturing processes facilitates process improvement, data-driven decision making, quality control, cost reduction, and risk management, ultimately enhancing overall operational performance and competitiveness in the market.
Resources
To help you continue learning statistics, here is a list of resources I’ve used and can recommend to you.
Websites:
https://www.itl.nist.gov/div898/handbook/toolaids.htm
https://online.stanford.edu/courses/sohs-ystatslearning-statistical-learning
YouTube channels:
https://www.youtube.com/@BrandonFoltz
https://www.youtube.com/@ResearchByDesign
https://www.youtube.com/@zedstatistics
https://www.youtube.com/@crashcourse
Books:
https://www.goodreads.com/shelf/show/statistics
Courses (free):
https://www.coursera.org/learn/probability-statistics/home/week/1
https://www.coursera.org/learn/stanford-statistics/home/week/1
Statistics – A Full University Course on Data Science Basics
Crash Course Statistics Preview
https://www.khanacademy.org/math/statistics-probability
https://brilliant.org/courses/probability-fundamentals/
https://www.edx.org/learn/statistics/stanford-university-statistical-learning
Software (not all are free):
https://www.minitab.com/en-us/products/minitab/
https://www.ibm.com/products/spss-statistics
https://www.gnu.org/software/pspp/
https://www.g2.com/categories/statistical-analysis/free


What are your thoughts? Have I covered everything or is there more you know and would like to share?
I’m always learning and improving this site and my blogs, so please feel free to get in touch with me via LinkedIn or this site to discuss any topics I have covered.
If you’re having trouble finding ways to progress check out these sites filled with free learning tools:


Discover more from The Chartered Engineer
Subscribe to get the latest posts sent to your email.