How to… create a Value Stream Map
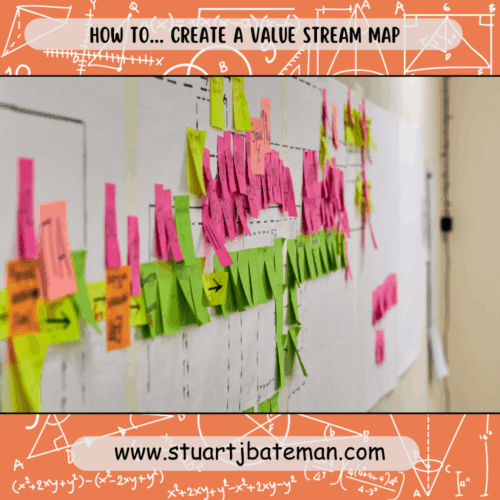
The more active you are in your learning, the more effective you’ll be – Marty Lobdell
How to… Create a Value Stream Map
In today’s economy, having an efficient and effective supply chain is more important than ever. Companies strive to reduce costs and maximize profits while delivering the best possible service. One way to help make this happen is by creating a Value Stream Map, which is a visual representation of the way material and information flow in a process or value stream. In this blog post, we’ll look at what a Value Stream Map is, why it’s important, and how to create one.
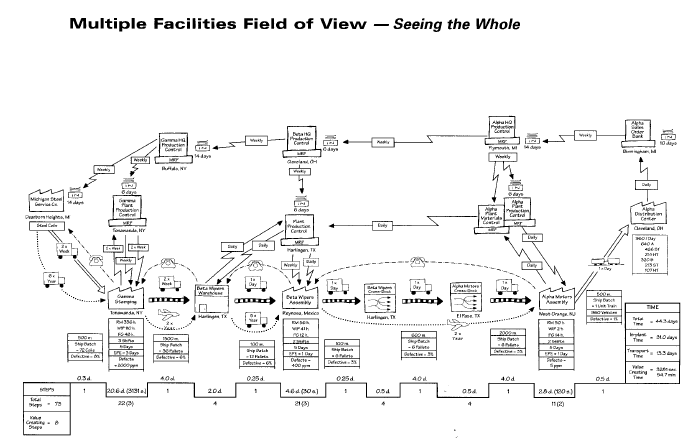
What is a Value Stream Map?
Simply put it’s a map of your companies processes, but it’s more than that as it can be used in multiple levels i.e. single station, production line, factory level and companies level (in this example we’ll cover a production line). The aim with VSM is for us to set the current state and then by using different lean tools we can kaizen areas to improve, this is done by creating the future state and setting priorities to what will have the biggest impact for little cost (think QCD).
Why Create a Value Stream Map?
It’s a powerful visual tool, used to see the flow and interactions of a process by allowing us to see the information / material and people flow. A well-made VSM will allow you to create a road map for the improvement opportunities that you have identified, this can then be put into an action plan to be project managed.
It also allows you to calculate the ratio between VA (value added) and NVA (non-value added) work going on in the factory, this term is called ‘Hidden factory‘ and we want the ratio to be as low as possible (however, as far as I know getting to and below 1:1 is extremely difficult). VSM is an exploratory tool where groups of people come together to help map out the process, led by anyone (but typically a Production engineer or change agent).
Using this tool you can identify areas of concern and areas where quick wins can be put into place and other areas that may need to be redesigned to flow better, this is a heuristic view of the shop floor.
How to Create a Value Stream Map
Below are the steps I take whenever I need to create a new VSM with an unknown process.
- Go to Gemba, and walk around the processes that you want to map out
- Note down the following
- Uptime – amount of time that the machine is available to run for work
- Cycle time of the process
- Quantity per cycle (also known as batch size)
- Number of operators required to run the process
- Any queues next to the machine
- Any paperwork / information used to run production at the machine daily
- Defect rates
- Work out the route for the materials, where they came from and where they will go afterwards
- Create a Spaghetti diagram
- If going outside then contact those contractors for their worst case lead time / batch quantities
- Remember to included travel time as part of that lead time
- Draw up the current state VSM using the symbols found here to describe what’s going on
- Using these icons to show the processes and flow
- Working from top left (end customer) going counter clockwise, follow the processes using to for fill the customer’s demand ending up back at the top left with the delivery.
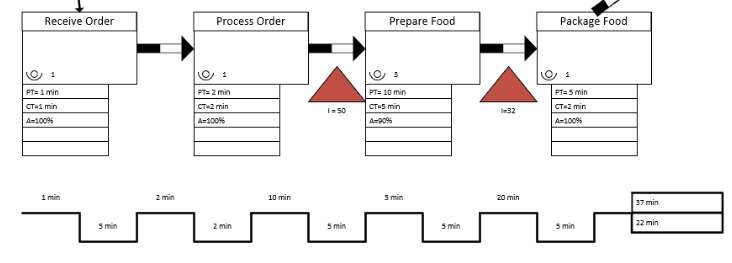
- Add the boxes underneath the processes to add in the information for Cycle time / Batch Qty / Uptime / Change Over / Defects
- Under the information in the boxes we can now add up the individual Value added and Non-value added times, we create two rows to show the different of the two.
- VA is the cycle time for one part
- NVA is the time parts are waiting for the process to be free for them (cycle time x batch size) or inventory that’s built or stocked next to the process, if the process has a changeover between batches this will need to be factored in i.e. (CT x Batch) + CO to give you the NVA
- Again depending on how complete a picture you want, adding Defect rate on the VSM will show the current Yield of the process, this is NVA but I’ve never added this to the time, it’s more a show of how many parts need to be processed on average to meet the demand, this will be the CT x Dmd x Yield rate to show you the efficiency of the process stage (not the line)
- You may have to create several VSMs to describe the production line, or state that you focus on the runners and repeater jobs and that changeover occurs for the low volume, either way the changeover will need to be eliminated or reduced to single minutes to allow multiple products to flow
- On the left hand side of this line add you the two values and to get a ratio by dividing NVA by VA, and is a measure of how effective you current process is, this can be used as a baseline to check after further improvements have been done to see the difference (or you can experiment by adjusting the cycle times / batches to see how this affects the ratio to give you a target to aim for)
- Depending on your needs, you can translate the VSM into a simulation using a free software called Jaamsim (https://jaamsim.com/), there are plenty of YouTube tutorial videos to help you get started.
- If you haven’t done the VSM as a group activity then sit down with people who run the system and ask them to validate it and make your corrections
- Ask them about the information systems and how they communicate and know what needs to be done next
- Hopefully you can see after doing a VSM why companies work towards Single piece flow.
Here’s a link to a video on YouTube that covers the process, by capturing similar data.

Utilizing Your Value Stream Map
So now you have a map, great, now what do I use it for? You say. Well, this is when the kaizen planning can come into play and we move to creating the future state map where we identify the wastes within the system and plan out how to remove them.
Again this isn’t the process level waste, this is the flow of material and information for the whole production line that we are identifying the waste for, it’s important to note that doing the process level before or after the line flow is a difficult decision and in the past I’ve gone for optimising the line flow before improving the individual stages.
Starting on the left hand size look for the 7 wastes that cause constraints for flow, you need to reduce or eliminate these to improve the system, identify the largest inventory / the movement of parts / the highest cycle time / the biggest queue / the mess of information flow and tackle each by creating an action plan to deal with them.
This activity to create the future state map needs to use a cross function team of people from the departments who interact with the production line you are improving, thus you end up with a well round heuristic view of the possible future.
Using the symbols found here, update the map (or redraw it) and add in the lean methods you plan on implementing to overcome the wastes you identified earlier.
An example of a future state VSM looks something like this:
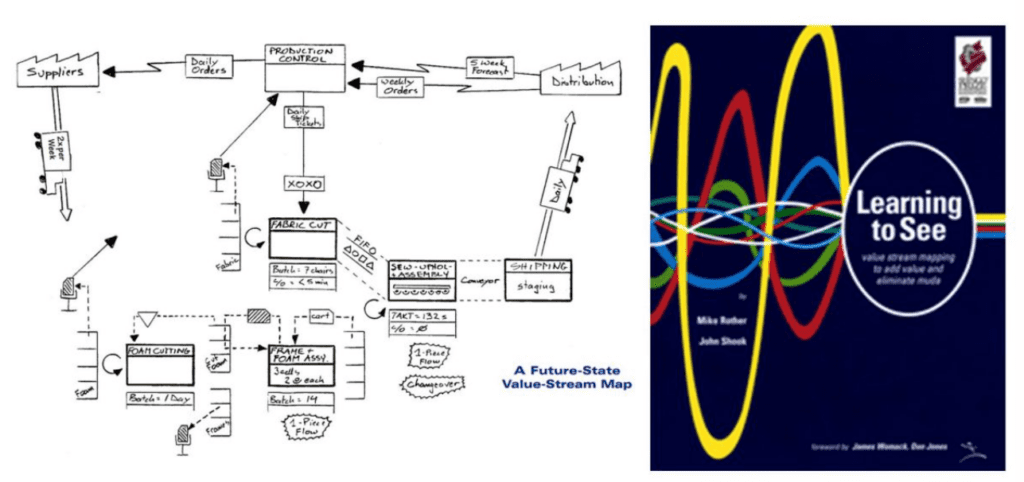
The action plan will drive the kaizen events that your team undergoes with the line operators to archive the improvement state. It’s good practise to keep a snag list/log that operators and the team can fill in so you can conduct a lessons learnt session after the kaizen for any follow up activities.
Once you have the new map with the action plan you can refer back to it at any time, over the period you improve the flow, this map will become the new current state map and then looking at that you and your team can decide on the next round of improvements, either that or move onto the next production line and let this one settle to see if the improvements stick and if any unforeseen problems occur.
Benefits of Creating a Value Stream Map
Instead of listing out all of the benefits for VSM, let me tell you how I used it to save my company money. As part of the introduction of a new product, we invested in a whole new production line consisting of several CNC machines, over the course of 2 years I had been steadily improving the throughput of that line. However, we saw the raw material supermarket starting to dry up (empty) and this continued for a few days before I stepped in to investigate.
I couldn’t see the problem and I knew that the issue was in the flow of materials so I wanted to map out the beginning part of the process from the raw material supplier to the CNC machines, this was 4 to 5 steps in my mind which included the use of an oven for heat treatment.
Sitting down I first mapped out the process that I believed was going on and then I got the Process manager and supervisor involved to verify what I had created, what I was missing were several steps, as it turned out that there was a high reject rate (which I then started to monitor) causing the parts to go round 4 loops of reworks and checking with the potential of failing again.
This meant that a large percentage about 40% were in this constant loop rework system, this couldn’t continue. So working on the VSM, I created the future state of how it needed to work, after which I visited one of our sub-contractors with the Process manager and the Quality manager to work with them to change how they machined our product which would overall improve the product they delivered to us (improving the quality and their process).
The result was the elimination of those loops and a system on par with the original map I drew up, this saved approx. £30,000 a year of rework, but also more importantly the 4-5 weeks Leadtime the parts were in that state.
All this came from me sitting down and mapping the process, checking that map and designing a new state that created a plan of action which we were able to achieve, had we not then we would had looked at different solutions.
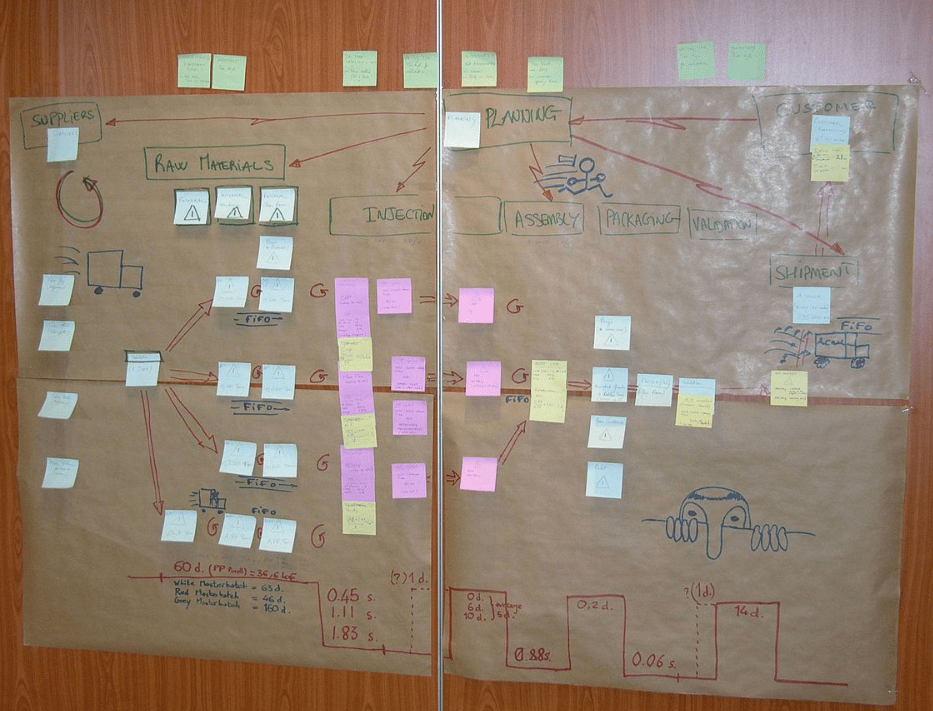
Most of my VSM’s are done using MS Excel, since it’s easier for me to adjust / update and share it with others and collaborate, but here’s an example of a manually drawn one which can be created with a group of SME’s (Subject matter experts).
Conclusion
Value Stream Mapping is a great way to gain insight into and improve your process. It can help reduce waste / costs, and identify inefficiencies and bottlenecks in your process. By creating a Value Stream Map and utilizing the insights you gain, you can take steps to make your processes more efficient and effective.
Here’s a simple illustration that rolls up my process above into an easy format for you to remember:

Now that you’ve learned how to create a Value Stream Map, go ahead and give it a try. Don’t forget to leave a comment and let us know how it went.
References
- The Lean Toolbox – Bicheno & Holweg
- The Lean six sigma pocket toolbox – George, Rowlands, Price & Maxey
- Lean six sigma 36 hour course – Shaffie and Shahbazi
- Lean Thinking – Womack and Jones
- Lean Solutions – Womack and Jones
- The Toyota Way fieldbook – Liker and Meir
- Lean lexicon – Lean Enterprise Institute
- The visual factory – Michel Grief
- Lean Smarts
- ISIXSIGMA.COM
Internal – Lean
Check out more Lean Manufacturing topics:
- What is Flow Production? Complete Implementation Guide 2025
- How to create a Value Stream map
- How to…use the Theory of Constraints (TOC): Streamlining Production
- Success Story: Transforming Workflows with Continuous Improvement
- How to..Conduct 3S


What are your thoughts? Have I covered everything or is there more you know and would like to share?
I’m always learning and improving this site and my blogs, so please feel free to get in touch with me via LinkedIn or this site to discuss any topics I have covered.
If you’re having trouble finding ways to progress check out these sites filled with free learning tools:


Discover more from The Chartered Engineer
Subscribe to get the latest posts sent to your email.