What is OEE and How to Use It to Boost Your Manufacturing Performance Today?

Information is the oil of the 21st century, and analytics is the combustion engine.
Peter Sondergaard
Overall Equipment Effectiveness (OEE) is one of the most powerful metrics in lean manufacturing, but it’s often misunderstood or misapplied. Before diving into what OEE is and how to calculate it, let me share my approach to implementing it effectively—because knowing where and when to use OEE is just as important as understanding the metric itself.
Strategic Implementation: Combining OEE with Theory of Constraints
Like all lean manufacturing tools, OEE works best when combined with other methodologies. I pair it with the Theory of Constraints (TOC) to ensure we’re focusing our efforts where they’ll have the greatest impact.
Table of Contents:
The Process Flow
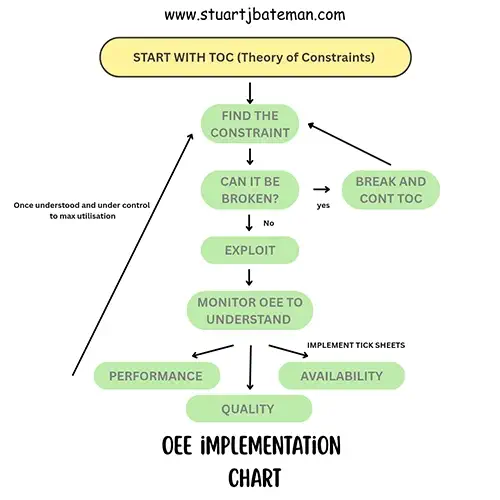
Here’s my systematic approach to identifying which processes deserve OEE monitoring:
1. Identify the Constraint
Follow the TOC process to find the bottleneck in your production system—the constraint that limits your overall throughput.
2. Ask: “Can This Constraint Be Broken?”
If yes, continue with the TOC process to eliminate it, then identify the next constraint. If no, move to the next step.
3. Exploit the Constraint
This is where OEE monitoring becomes invaluable. To maximize output from a constraint we can’t eliminate, we need deep insight into how it’s performing and where time is being lost.
4. Deploy OEE Monitoring
Install OEE tracking at the constraint to understand and exploit every opportunity for improvement.
Critical Implementation Notes
Stop monitoring once you’ve exploited the constraint. Like all inspection activities, monitoring is waste beyond its specific function. Once you’ve understood and optimised the process, remove the monitoring and move to the next constraint.
Don’t monitor everything. Many companies make the mistake of tracking OEE across every process. This creates information overload, prevents focus, and makes it impossible to fix anything effectively. Monitor one constraint at a time.
Starting Simple: Paper-Based Data Collection
OEE monitoring doesn’t require expensive software. Following lean principles, start with what costs almost nothing: paper and pen. A simple tick sheet can capture everything you need.
What to Track:
- Breakdowns
- Setup/Changeover times
- Scrap (both in production and during setup)
- Throughput – parts started and parts finished from each process/stage
Train operators to record these events as they happen. The data collection should take seconds, not minutes.
Data Processing:
Use Excel with pivot tables and formulas to convert your raw data into actionable information. This is a temporary setup while you’re learning about your constraint. (For Excel tutorials, I recommend Leila Gharani’s YouTube channel.)
Later, you can implement database solutions like Microsoft Access or dedicated OEE software, but only after you’ve proven the value with your paper-based system.
Collect your tick sheets on a daily basis and input the data into a pivot table that has the formulas to calculate the Availability % (100% = your daily machine hours – Breakdowns + Setup/changeovers), Quality % (Expected daily output – scrap) and Performance % (Expected throughput – Actual).
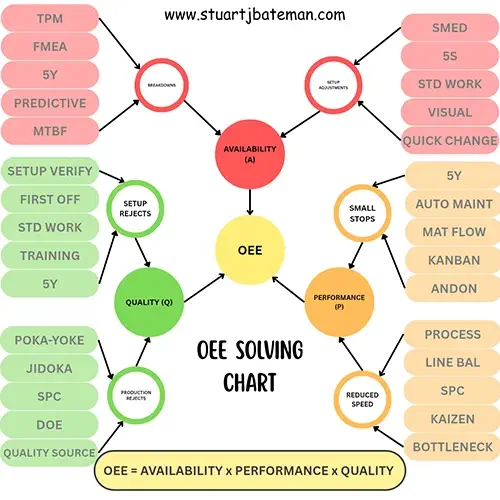
Understanding OEE: The Three Components
OEE breaks down into three key metrics, each revealing different types of losses – What you want to focus on are any that drop below 85%:
1. Availability
Measures actual operating time versus planned production time. Affected by:
- Breakdowns: Equipment failures and unplanned downtime
- Setup and Adjustments: Changeovers and tooling changes
2. Performance
Measures actual speed versus ideal cycle time. Affected by:
- Small Stops: Brief interruptions and idling
- Reduced Speed: Running below optimal rate
3. Quality
Measures good parts versus total parts produced. Affected by:
- Startup Rejects: Defects during production ramp-up
- Production Rejects: Defects during stable production
These three components multiply together to give you your OEE percentage:
OEE = Availability × Performance × Quality
Internal – Lean
Check out more Lean Manufacturing topics:
- What is Flow Production? Complete Implementation Guide 2025
- Learn what flow production is and how to implement it in manufacturing. Includes step-by-step process, real-world examples, and proven tools to increase output.
- How to create a Value Stream map
- Companies strive to reduce costs, create space and continuously imp, one way to help make this happen is by creating a Value Stream Map.
- How to…use the Theory of Constraints (TOC): Streamlining Production
- Unlock efficiency with Theory of Constraints! Learn to identify bottlenecks, optimize processes, and boost productivity for success.
- Success Story: Transforming Workflows with Continuous Improvement
- Explore a real-life success story of implementing continuous improvement activities. How the involvement of operators led to significant changes.
- How to..Conduct 3S
- Master 3S methodology (Sort, Set, Shine) with this complete lean manufacturing guide. Learn implementation steps, workplace organization, and 3S vs 5S differences from 22 years experience.
The Six Big Losses
The breakdown above reveals the Six Big Losses that erode manufacturing efficiency. Your OEE data will show you which losses are most significant in your process, allowing you to prioritise improvement efforts.
Turning Data Into Action
Collecting data is pointless without analysis and action. Once you know which of the three area (Availability, Quality or Performance has dropped, you need to identify which of the six loses is also affected):
Pattern Recognition
Look for patterns across:
- Time of day or shift
- Specific operators
- Particular machines or stages
- Different products or materials
- Frequency and duration of losses
These patterns point you toward root causes (there may be others, so don’t just stick to these!).
Engineering Toolkit: Matching Tools to Loss Types
Once you understand the which of the big six is being affected (sometimes it’s more than one), select from this comprehensive toolkit. Not every tool will apply to every situation—use your engineering judgment to choose what’s most effective for your specific constraint.
Toolkit for Availability Losses
Target: Breakdowns, Setup & Adjustments
Lean Manufacturing Tools:
- SMED (Single-Minute Exchange of Die) — Systematically reduce changeover times through external/internal task separation
- TPM (Total Productive Maintenance) — Prevent breakdowns through autonomous maintenance and planned maintenance schedules
- 5S — Organize workspaces to reduce setup time and eliminate searching for tools/materials
- Standardised Work (SOPs) — Document best-practice changeover sequences to reduce variation
- Visual Management — Shadow boards, colour coding, and visual cues to speed up setups
- Andon Systems — Immediate notification of breakdowns to reduce response time
- Quick Changeover Kits — Pre-staged tooling and materials for common setups
Engineering & Maintenance Approaches:
- Predictive Maintenance — Vibration analysis, thermal imaging, oil analysis to prevent failures
- MTBF & MTTR Analysis — Track Mean Time Between Failures and Mean Time To Repair to identify chronic issues
- Failure Mode Effects Analysis (FMEA) — Systematically identify and prevent potential failure modes
- Root Cause Analysis (RCA/5 Whys) — Dig deep to find true causes, not symptoms
- Spare Parts Management — Strategic inventory of critical components to reduce repair time
- Tool/Die Design Improvements — Standardize mounting systems, add locating pins, quick-release mechanisms
- Parallel Processing — Prepare next setup while current job runs
Toolkit for Performance Losses
Target: Small Stops, Reduced Speed
Lean Manufacturing Tools:
- Value Stream Mapping — Identify bottlenecks and non-value-added activities
- Continuous Improvement (Kaizen) — Regular incremental improvements through team problem-solving
- Time Studies — Understand actual vs. ideal cycle times to identify gaps
- Standardised Work — Establish best-practice methods to eliminate variation in cycle times
- Line Balancing — Optimize work distribution to eliminate bottlenecks
- Cellular Manufacturing — Reduce material handling and transportation time
- Pull Systems (Kanban) — Smooth production flow and reduce small stops from material shortages
Engineering & Process Approaches:
- 5 Whys/Root Cause Analysis — Understand why equipment runs below rated speed
- Process Optimisation — Adjust speeds, feeds, temperatures to optimal parameters
- Bottleneck Analysis — Use Theory of Constraints to systematically address constraints
- Material Flow Analysis — Eliminate delays from poor material presentation or handling
- Ergonomics Assessment — Reduce operator fatigue that slows performance
- Automation/Mechanisation — Where appropriate, eliminate manual handling delays
- Statistical Process Control (SPC) — Monitor process stability and capability
- Preventive Lubrication/Cleaning — Reduce friction and contamination that slow machines
- Complexity Reduction — Simplify product designs or reduce SKU proliferation
Maintenance Approaches:
- Autonomous Maintenance — Operators perform basic maintenance (cleaning, lubrication, inspection)
- Condition-Based Monitoring — Real-time monitoring to catch performance degradation early
Toolkit for Quality Losses
Target: Startup Rejects, Production Rejects
Lean Manufacturing Tools:
- Poka-Yoke (Error-Proofing) — Design fixtures, guides, and sensors to prevent defects
- Standardised Work (SOPs) — Consistent processes produce consistent quality
- Jidoka (Autonomation) — Build quality at the source with automatic defect detection and stopping
- First-Time-Through (FTT) Tracking — Measure and improve first-pass yield
- Quality at Source — Operators inspect their own work immediately
- Andon Cords/Systems — Stop and fix problems immediately rather than passing defects forward
Quality & Engineering Approaches:
- Statistical Process Control (SPC) — Control charts to maintain process within specifications
- Design of Experiments (DOE) — Systematically optimize process parameters
- Process Capability Studies (Cp/Cpk) — Understand if your process can consistently meet specifications
- Failure Mode Effects Analysis (FMEA) — Prevent quality issues before they occur
- Root Cause Analysis (5 Whys, Fishbone/Ishikawa) — Identify and eliminate sources of defects
- Gage R&R Studies — Ensure measurement systems are reliable
- Mistake-Proofing — Design products and processes to be impossible to do incorrectly
- Setup Verification Checklists — Reduce startup rejects through systematic verification
- Standard Operating Procedures — Document quality requirements and inspection criteria
- First-Off Inspection — Formal approval of first piece before full production run
- Tool Life Management — Replace cutting tools, dies, molds before they produce defects
- Process Parameter Monitoring — Real-time tracking of critical variables (temperature, pressure, speed, etc.)
- Supplier Quality Management — Ensure incoming material quality to prevent downstream defects
- Training Matrix — Ensure operators are properly trained and certified for quality-critical operations
Cross-Cutting Tools (Applicable to Multiple Loss Types)
- 5 Whys — Universal root cause analysis technique
- Kaizen Events — Focused improvement workshops for any loss type
- Gemba Walks — Go to the actual place to observe and understand problems
- A3 Problem Solving — Structured problem-solving methodology
- PDCA Cycle (Plan-Do-Check-Act) — Systematic approach to testing improvements
- Pareto Analysis — Focus on the vital few causes creating most losses
- Fishbone/Ishikawa Diagrams — Organize potential causes across categories (People, Process, Materials, Equipment, Environment, Management)
- Overall Equipment Effectiveness (OEE) Monitoring — The tool itself helps identify where to focus next

How to Select the Right Tool
- Start with Root Cause Analysis — Always begin with 5 Whys or similar techniques to understand why the loss occurs
- Match Tool to Cause — Choose tools that directly address the identified root cause
- Consider Complexity — Start with simple, low-cost solutions before complex ones
- Test and Measure — Your OEE baseline lets you measure effectiveness of each intervention
- Layer Tools — Often, multiple tools work together (e.g., SMED + 5S + Standardized Work for changeover reduction)
- Involve the Team — Operators and maintenance staff often know which approaches will work best
Measuring Improvement
The beauty of this approach is built-in measurement. By monitoring before making changes, you establish a baseline. After implementing lean tools, your OEE data immediately shows whether improvements are working—and by how much.
Common Pitfalls to Avoid
- Monitoring without action: Collecting OEE data indefinitely without making improvements
- Tracking too many processes: Diluting focus and resources
- Ignoring the human element: Not involving operators in analysis and problem-solving
- Analysis paralysis: Spending too long studying data instead of testing solutions
- Software before strategy: Investing in expensive monitoring systems before understanding the methodology
The Bottom Line about OEE
OEE is a powerful tool for uncovering hidden capacity in your constraint processes. When combined with Theory of Constraints to identify where to focus and lean tools to address what you find, OEE monitoring can reveal significant productivity gains—often 10-30% or more—that were invisible before.
The key is strategic application: identify your constraint, monitor it with OEE, understand the losses, fix them using appropriate lean tools, then move on to the next constraint. This focused, iterative approach turns OEE from just another metric into a genuine driver of manufacturing performance.
Additional Resources
For further learning about OEE implementation and best practices:
Foundational Learning:
- OEE.com (comprehensive free resource)
- Lean Production guide to OEE methodology
Practical Implementation:
- YouTube: Search for “Vorne OEE,” “Gemba Academy OEE,” and “Lean Smarts OEE” for video tutorials
- Reddit r/manufacturing for peer discussions
Academic Deep-Dive:
- Muchiri & Pintelon (2008): “Performance measurement using overall equipment effectiveness (OEE)” – International Journal of Production Research
- MDPI Applied Sciences (2020): Systematic literature review of OEE approaches (open access)
Books:
- “Introduction to TPM” by Seiichi Nakajima (original work introducing OEE)
- “OEE for Operators” by Productivity Press Development Team


What are your thoughts? Have I covered everything or is there more you know and would like to share?
I’m always learning and improving this site and my blogs, so please feel free to get in touch with me via LinkedIn or this site to discuss any topics I have covered.
If you’re having trouble finding ways to progress check out these sites filled with free learning tools:


Discover more from The Chartered Engineer
Subscribe to get the latest posts sent to your email.
