How to Create an Ishikawa Diagram: Lessons from Teaching Year 10s
If you can’t describe what you are doing as a process, you don’t know what you’re doing.
— W. Edwards Deming
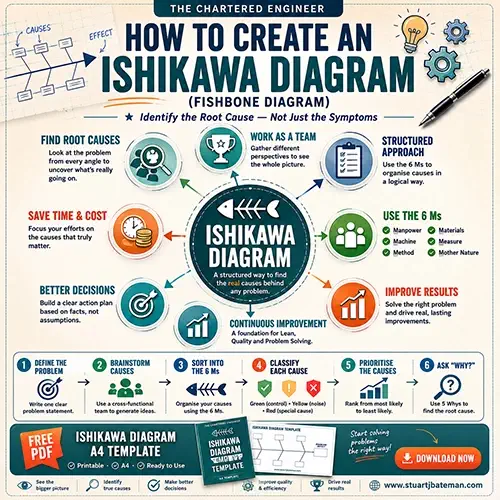
If Deming’s challenge is to describe a process, the Ishikawa diagram is one of the best tools ever devised for describing what is going wrong with one. It forces a team to look at a problem from every angle simultaneously — and what comes out of that exercise is almost always a richer, more honest picture of the real causes than anything a single expert could produce alone.
This post explains what an Ishikawa diagram is, how to construct one step by step, and how to use it to move from a messy list of potential causes to a prioritised, actionable investigation plan. It also tells the story of how I taught the method to a class of Year 10 students — because if a group of 14 and 15-year-olds can build one in 45 minutes, so can your team.
The Blind Men and the Elephant
Around 2015, I was volunteering as an Enterprise Adviser supporting my old secondary school in Gosport. An opportunity came along to teach a lesson to a class of eight Year 10 students — 14 and 15-year-olds — and the method I chose to teach them was the Ishikawa diagram.
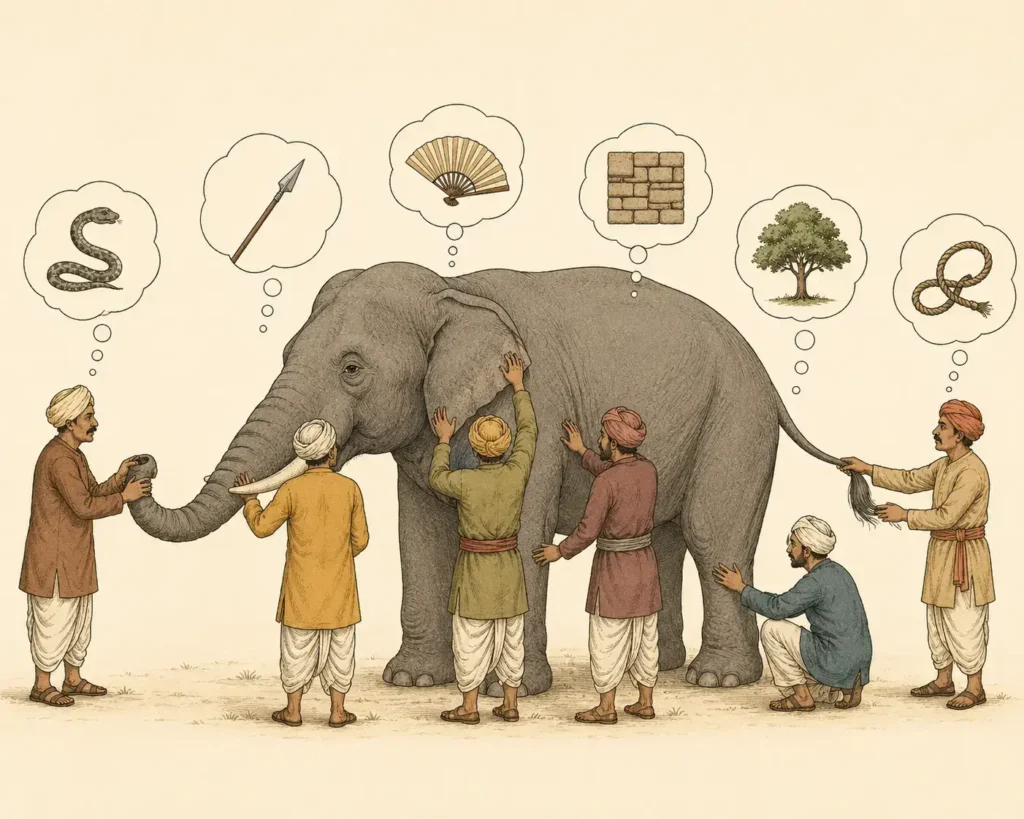
Before the lesson, I was leaving work to head over to the school when my line manager stopped me with a story. It was the parable of the blind men and the elephant — and it was the perfect opening.
The story goes like this: six blind people are each standing at a different point around an elephant. Each one reaches out and describes what they are feeling. One feels the trunk and says it is a snake. Another feels a leg and describes a tree trunk. A third touches the side and thinks it is a wall. Each person is describing their own experience accurately — but not one of them can see the whole animal.
Peter Senge uses this parable in The Fifth Discipline (1990) to illustrate one of the most persistent problems in organisational thinking: that people in different roles within a system each see only their own part of it, and that seeing the whole requires deliberately bringing those partial perspectives together. That is precisely what an Ishikawa diagram does.
I put the question to the class: if you had six people, each feeling a different part of an elephant, could they collectively build an accurate picture of the whole? The answer, most of the time, is no — not unless they share what they each know and look at all the information together.
That is the mindset the Ishikawa diagram is built on.
What Is an Ishikawa Diagram?
An Ishikawa diagram — also called a fishbone diagram or cause-and-effect diagram — is a structured brainstorming tool used to identify the potential root causes of a problem or symptom. It was developed by Kaoru Ishikawa, a Japanese quality pioneer, and is one of the seven basic quality tools recognised by the ASQ.
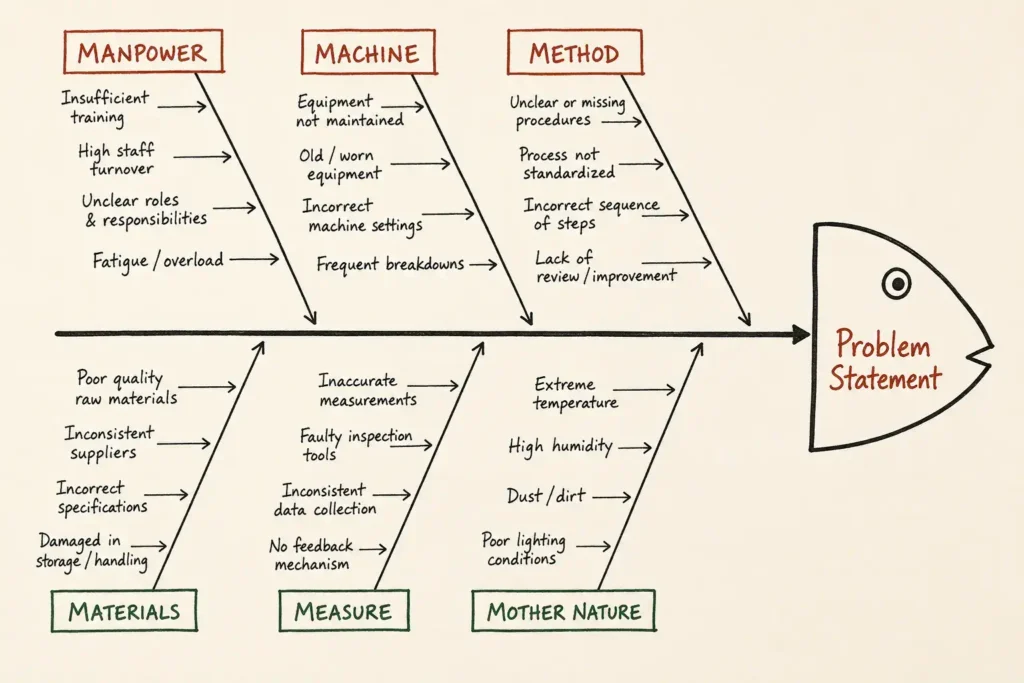
The diagram takes its name from what it looks like: a fish skeleton. The head of the fish contains the problem statement. The spine runs horizontally from the head. The bones branching off the spine represent categories of potential causes, and the sub-bones off each branch represent specific causes within each category.
The power of the tool is not in the diagram itself — it is in the conversation that builds it. When a cross-functional team constructs an Ishikawa diagram together, they are forced to consider causes from perspectives they would not individually have reached.
The 6 Ms — The Standard Framework
The most widely used format for the Ishikawa diagram in manufacturing environments is built around the 6 Ms. These are the six categories used to organise potential causes:
- Manpower — the people involved in the process. Training, experience, fatigue, communication, and human error all sit here.
- Machine — the equipment and tooling. Condition, calibration, maintenance history, capability, and wear.
- Method — the process and procedures. How the work is specified, sequenced, and controlled.
- Materials — the inputs to the process. Raw material variation, supplier quality, storage conditions, and traceability.
- Measure — the measurement systems. Calibration, Gage R&R, sampling method, and data recording.
- Mother Nature — the environment. Temperature, humidity, vibration, lighting, and other external conditions.
These six categories are a starting framework, not a rigid constraint. In service environments, the 6 Ms are sometimes adapted — People, Process, Technology, Policy, Environment — but for manufacturing and production engineering, the 6 Ms cover the vast majority of cause categories you will encounter.
How to Construct an Ishikawa Diagram
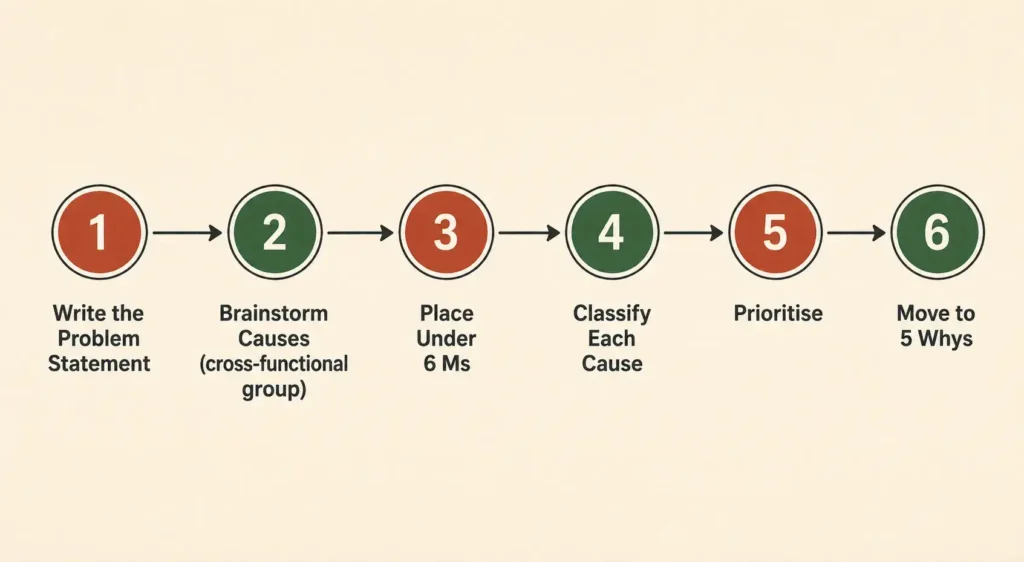
Step 1 — Define the Problem Statement
The problem statement goes at the head of the fish. Everything that follows must be anchored to this single, clearly defined symptom. A vague problem statement produces a vague diagram — so take the time to agree on the wording before you begin.
Good problem statement: “Finished assemblies are failing the final leak test at a rate of 8% over the past four weeks.” Weak problem statement: “Quality problems.”
The distinction matters. The more specific the problem statement, the more focused the cause analysis will be.
Step 2 — Draw the Fishbone Structure
Draw the spine — a horizontal arrow pointing to the right, with the problem statement box at the arrowhead. Then draw six diagonal bones branching off the spine — three above and three below — and label each one with one of the 6 Ms.
This is best done on a whiteboard or a large sheet of paper where the whole team can see it. In the Year 10 lesson, I used the whiteboard and constructed the diagram in front of the class as I explained the method — so they could see it take shape before they tried it themselves.
Step 3 — Generate Causes Using Post-It Notes
Ask every member of the team to write down all the potential causes they can think of — one cause per Post-it note. Encourage quantity at this stage — do not evaluate or dismiss ideas during the generation phase. Every perspective is valid, including the ones that seem unlikely.
This is where the blind men and the elephant principle applies most directly. The operator who runs the process every day will surface causes the engineer never sees. The quality inspector will identify measurement-related causes that neither the operator nor the engineer would have considered. The diagram is most powerful when it draws on all of them.
In the Year 10 lesson, I gave the students three scenarios to work through: a flat tyre, a car breakdown, and being late for school. These were familiar enough to generate genuine ideas without requiring specialist knowledge — and they produced excellent, creative cause lists from both teams.
Step 4 — Place Causes Under the Right Heading
Take each Post-it note and, as a group, decide which M it belongs under. This step often generates the most useful discussion — a cause may sit under more than one category, in which case duplicate the note and place it under each relevant heading. The debate about where a cause belongs often reveals important information about the nature of the problem.
By the end of this step, you should have agreement from the whole team that the causes are placed correctly.
Step 5 — Identify What Is Within Your Control
Review all the causes on the diagram and classify them:
- Within your control — causes you can investigate and act on directly
- Noise — causes that exist but cannot be practically controlled or changed
- Special causes — rare or exceptional circumstances that fall outside normal process variation
This classification reduces the full list to a workable set of actionable causes — the ones that will form the basis of your investigation plan.
Step 6 — Prioritise and Move to 5 Whys
With a refined list of controllable causes, prioritise them from most likely to least likely. This prioritised list becomes your action plan for investigation. For each cause on the list, conduct a 5 Whys analysis — drilling down from the symptom to the underlying root cause by asking “why” at each level until the true source of the problem is identified.
The Ishikawa diagram identifies the candidates. The 5 Whys analysis confirms which one is actually responsible.
A dedicated post on 5 Whys — including how to run the analysis and avoid the common pitfalls — is in preparation. An internal link will be added here on publication.
The Year 10 Lesson — What Happened
With the elephant parable as their introduction, the class split into two teams and worked through all three scenarios. The instructions I gave were simple: agree on the problem statement, construct the bones, generate causes, debate the placement, and present back.
What struck me was how quickly the method became intuitive once the structure was in place. The students were generating genuine, considered causes within minutes. The debate about where each cause belonged — is a punctured tyre a Machine problem or a Mother Nature problem? — produced exactly the kind of cross-functional thinking the diagram is designed to unlock.
The lesson ran to 45 minutes. By the end, both teams had produced complete, populated fishbone diagrams for all three scenarios. The A4 templates I had designed beforehand gave them a starting structure that removed the blank-page problem and let them focus on the thinking.
It reinforced something I have seen consistently in manufacturing environments: the Ishikawa diagram is accessible to anyone willing to engage with it. You do not need an engineering qualification or a Six Sigma belt. You need a clear problem statement, a willingness to consider all possibilities, and the discipline to follow the structure.
Key Takeaways
- The Ishikawa diagram is a structured brainstorming tool for identifying the potential root causes of a problem — it works by organising causes into categories and building a shared picture from multiple perspectives
- The 6 Ms (Manpower, Machine, Method, Materials, Measure, Mother Nature) are the standard cause categories for manufacturing and production engineering
- The problem statement must be specific — vague problem statements produce vague diagrams
- The tool is most powerful as a group exercise — the cross-functional perspective is what makes it effective, not the diagram itself
- Post-it notes allow causes to be moved, duplicated, and rearranged as the team debates placement — keep the process fluid
- Classify causes into controllable, noise, and special causes before prioritising — this converts the diagram into an actionable investigation plan
- The Ishikawa diagram identifies the candidates for root cause. The 5 Whys analysis confirms which one is actually responsible
Frequently Asked Questions
What is an Ishikawa diagram used for? An Ishikawa diagram is used to identify and organise the potential root causes of a problem or quality issue. It is one of the seven basic quality tools recognised by the ASQ and is widely used in manufacturing, production engineering, and continuous improvement activities.
What are the 6 Ms in an Ishikawa diagram? The 6 Ms are the six cause categories used in the standard manufacturing Ishikawa format: Manpower, Machine, Method, Materials, Measure, and Mother Nature. They provide a structured framework for exploring all possible sources of a problem rather than focusing on the most obvious cause.
What is the difference between an Ishikawa diagram and a fishbone diagram? They are the same tool. Fishbone diagram is the common name, derived from the shape of the finished diagram. Ishikawa diagram is the formal name, attributed to Kaoru Ishikawa who developed the method. Cause-and-effect diagram is a third name sometimes used in quality management documentation.
How many people do you need to run an Ishikawa session? There is no fixed number, but the tool works best with a cross-functional group of three to eight people — enough to bring different perspectives without the session becoming unmanageable. The key is having representation from all the functions that touch the process: operators, engineers, quality, maintenance, and supervisors where relevant.
What comes after the Ishikawa diagram? Once the diagram is complete and causes have been classified and prioritised, the next step is a 5 Whys analysis on each of the prioritised controllable causes. This drills down from the symptom to the true root cause, which then drives the corrective action plan.
Downloadable Resource
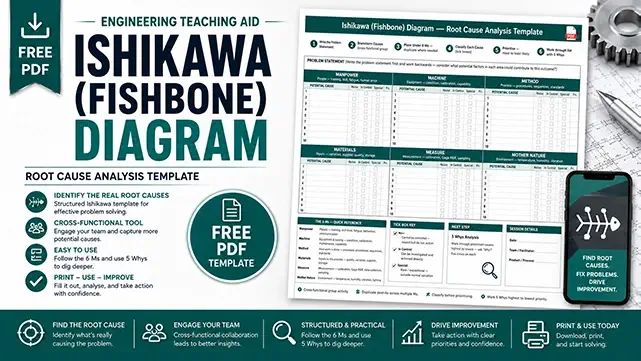
A printable A4 Ishikawa diagram template — in the same style as the examples in this post — is available as a free PDF download below. It includes the 6 Ms pre-labelled, a problem statement box, sub-bone writing lines, a notes section, and a date and team reference field.
Related Posts
- How to Create a Value Stream Map — stuartjbateman.com/how-to-create-a-value-stream-map/
- How to Implement SMED — stuartjbateman.com/how-to-implement-smed/
- Spaghetti Diagram: The Art of Untangling Your Production Process
- Line Balancing in Manufacturing: How to Create Flow at the Right Rate
- Gage R&R Explained: A Practical Guide for Manufacturing Engineers
References & Further Reading
- Senge, P.M. (1990). The Fifth Discipline: The Art and Practice of the Learning Organisation. Doubleday.
- American Society for Quality (ASQ) — Seven Basic Quality Tools: asq.org/quality-resources/seven-basic-quality-tools
- Ishikawa, K. (1968). Guide to Quality Control. Asian Productivity Organisation.
Author Bio
Stuart Bateman is a Chartered Engineer with 22 years of experience across project, manufacturing, and production engineering. He writes about engineering tools, career development, and practical manufacturing techniques for engineers at every stage of their career.
Internal – Lean
Check out more Lean Manufacturing topics:
- What is Flow Production? Complete Implementation Guide 2025
- Learn what flow production is and how to implement it in manufacturing. Includes step-by-step process, real-world examples, and proven tools to increase output.
- How to create a Value Stream map
- Companies strive to reduce costs, create space and continuously imp, one way to help make this happen is by creating a Value Stream Map.
- How to…use the Theory of Constraints (TOC): Streamlining Production
- Unlock efficiency with Theory of Constraints! Learn to identify bottlenecks, optimize processes, and boost productivity for success.
- Success Story: Transforming Workflows with Continuous Improvement
- Explore a real-life success story of implementing continuous improvement activities. How the involvement of operators led to significant changes.
- How to..Conduct 3S
- Master 3S methodology (Sort, Set, Shine) with this complete lean manufacturing guide. Learn implementation steps, workplace organization, and 3S vs 5S differences from 22 years experience.



What are your thoughts? Have I covered everything or is there more you know and would like to share?
I’m always learning and improving this site and my blogs, so please feel free to get in touch with me via LinkedIn or this site to discuss any topics I have covered.
If you’re having trouble finding ways to progress check out these sites filled with free learning tools:


Discover more from The Chartered Engineer
Subscribe to get the latest posts sent to your email.
